First up, the camera, mine is capable of displaying one of two histograms, one of them shows the overall light in the image and the other shows the same thing but in the three colour channels in which the device operates, red, green and blue.
Lightroom's histogram shows the colour spaces as well as highlight and shadow. A couple of people on g+ asked me to write this tutorial, I've agreed to do it on the basis that it will help me to further understand the histogram. To ensure I have complete understanding I've referenced the manual for Lightroom 5. I'm not going to go into huge detail because I don't want to overwhealm the new histogram user, if you need more information the reference manual is available from adobe for free download.

First up, lets look at the histogram, it's a fairly simple device to people familiar with graphs. On camera the histogram is generally read only and will look somewhat similar depending on your device.
Let me borrow some text from the LR manual to describe the histogram because I think they did it so well "A histogram is a representation of the number of pixels in a photo at each luminance percentage. A histogram that stretches from the left side of the panel to the right side indicates a photo that takes full advantage of the tonal scale. A histogram that doesn’t use the full tonal range can result in a dull image that lacks contrast. A histogram with spikes at either end indicates a photo with shadow or highlight clipping. Clipping can result in the loss of image detail."
Ok, first lets talk overall about what you're seeing
How do cameras see colour? Before we get into the histogram, there is an important concept we need to first talk about. Your camera does not see colour the way you do, for each sensor element (or pixel if you prefer although that's not strictly true but good enough for this purpose) there are three sensors, one measures the amount of red light, another green light and another blue light. The three measurements together can be used to make up any colour within the gamut of the device to recognise, encode and store. Cameras see colour in eight bits (and ONLY eight bits) per colour, this means each of the three colours Red Green and Blue (RGB) can store values between 0 and 255. 0 means that there is no colour of that part of the spectrum at that location of the image and 255 means that there is an overwhelming amount of that colour.
Much like mixing paint colours the RGB measurements are mixed to produce the image you look at through computer logic. The RGB values are stored within a RAW file. Encoded RGB values with clever compression techniques are also stored in JPEG, PNG and other formats.
You've probably seen bits described elsewhere in the imaging detail of your camera of eight, ten, twelve, fourteen and sometimes as high as sixteen. This bit number does not change the eight bit nature of RGB but it does change the width of the histogram - the tonal range that the device can capture and understand.

The best analogy I can think of is a picket fence. A picket fence which has a gap between each picket might be considered eight bit tonal range. A higher resolution picket fence would have a smaller gap and a so on until you reach a fence that is solid with no gaps between the pickets that defines a perfect utopia of sensor technology that we are a long way from today.
Clipping Warnings: there are two arrows on the top left and top right of the histogram. They represent the clipping warning controls and they are on off switches or buttons. The default to on. Clicking on one with your pointer turns them on and off. The left hand side governs warnings about loss of detail in shadows and the one on the right governs warnings about loss of detail in highlights.

Black Clipping: this warning will show as bright blue dots or shaded areas of your image. It is a warning letting you know that at current histogram levels too much of the image is totally black (RGB values of 0, 0, 0). This will also show as a peak in the left column of the histogram visual display.
In this image the warning is coming in part of a grape vine in shadow.

White Clipping: We often see this in the sky of images or around other bright sources of light, it means that you've lost detail because there has been too much light for sensor to record effectively in this area. This shows up as bright red dots or shaded areas of your image.
This warning is coming in sky that is simply too bright where the exposure has been for the landscape ignoring the sky.
I might note these clipping errors and the limited tonal range of camera sensors is the reason behind the somewhat laborious techniques of increasing the tonal range including blending multiple exposures, tonal mapping of single or multiple images and high dynamic range (HDR) techniques.
What does the graph mean?
Well to understand that we need to delve back into the colours, the graph is a sampling across your image and again to quote the LR manual is "representation of the number of pixels in a photo at each luminance percentage". So what does that mean to you as the photographer? Well it means that LR has sampled the image and worked out based on the space it has to show you the histogram how many pixels there are of each of the available horizontal points on the graph. Simple huh? No... ok as each colour in each of the spots gets brighter the graph will be higher. Where there is no light it will flat line along the bottom. Where there is too much light it will flat line across the top.

The graph shows in the three colours red, green and blue with a shaded area for each. Where the colours overlap the graph changes. Grey means that all RGB overlap at that position, yellow appears when red and green overlap, magenta where red and blue overlap and finally cyan when green and blue overlap.
Within Lightroom in Develop mode (as of version 4 and continued into version 5) the histogram is divided into areas representing blacks, shadows, exposure and highlights and whites.
Each section shows the corresponding area affected by the exposure sliders in the panel below. Each of them affects overall the height of the graph, or more correctly a percentage range of the pixels.
You can adjust the amount of pixels that fall into each area using either the sliders or by dragging the boundaries of the five histogram areas to expand the tonal range attributed to that area of the light.
So what do I do with it?
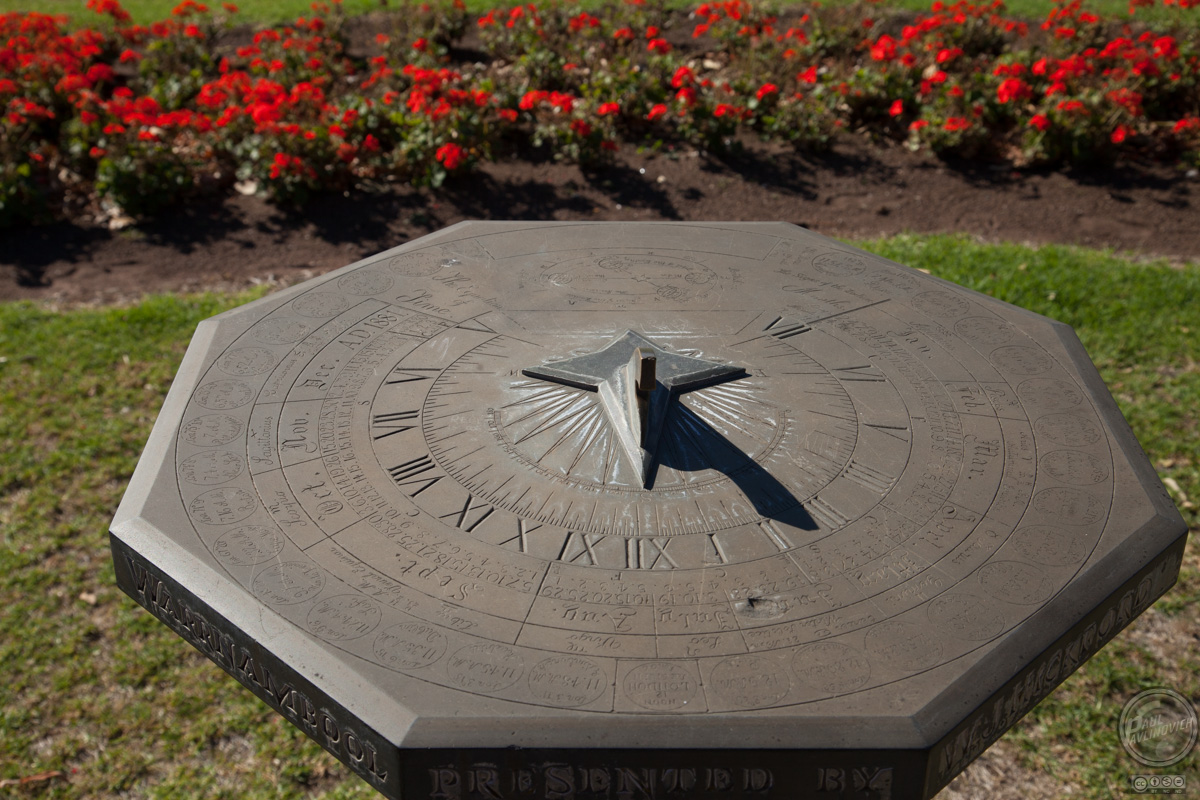 Well, now that is a good question, we now know that for a standard image it is desired to have all of the graph from left to right to peak as high vertically as possible. However, this is for a standard image. If you lived in Kodak world of some time back this would be a bright sunny day with an image shot around f/11 of a beautiful landscape with every colour in the rainbow present and accounted for in all the possible shades. The brainiacs of workshops and courses will often tell you it must cover the whole tonal range. I really don't think so. First up, compare the graph with the image itself. You can see that the majority of the exposure is off to the left of the image meaning there is loads of detail in the blacks, shadows, midtones, but that the highlights and whites are lacking. This is quite normal because this is an image that is predominantly grey. So there should not be a lot of highlights and whites.
Most of us probably shoot in other conditions including artificial light and we shoot images of widely varying subjects. The image from the graph used in the five areas above is a an example of an acceptable image, not an exiting image, but acceptable and would I change the histogram - not in this case, but we will explore what happens when we do.

First up, lets drag the histogram over to the right by pulling the right boundary of the section labelled Exposure to the right of the image.

This has resulted in a significantly brighter image, it's certainly less dull than the image above, however, as a documentary image it is now lacking because it's harder to read the inscriptions.
Where this modification would come into its own is if we were planning on doing further conversion of the image to monochrome or indeed if printing it. The first image would have been quite unacceptable printed but the second would be better.
Should I do this to all of my images?
Of course you should. Well, no, ok you shouldn't. I'm going to run through a bunch of example image that I find acceptable and show you their histogram. As you can see the histogram varies wildly from image to image. The first rule of thumb is look at the image. It should be evident to you if it needs to be darker or lighter in general to match your memory of the subject.

Ok in this image, the histogram is telling us we've got a lot of blue in the highlights and that there is a mix of red and green in the mid tones of the exposure and there is a modicum of colour in the shadows and blacks.
This is an acceptable histogram. There is no clipping. This is a well exposed image for the subject matter.
When I first encountered this image, there was some clipping within the blacks so I did drag that area slightly to the right into the shadows which cured the clipping and improved the image contrast in these areas.

In this image which is mostly a green subject, not surprisingly there is a lot of green. There is a minor clipping warning on the green channel shown on the right hand side and one in the magenta channel on the left.
I haven't altered this image from the exposure I captured because I don't think it needs it despite the slight clipping.

This church in Warrnambool exposed by tungsten street lighting really does need some attention. We can see from the histogram there there is very little representation of colour except in the blue channel (sky is blue, even in the dark!). There is major clipping in the blacks and a lot of areas with highlight and white clipping.
These warnings give us the starting point to fix this image, but before I did that, I'd fix the white balance and straighten and crop the image. This way we'd be working on the histogram only for the image parts we want to keep.

There is no doubt in my mind the best place to fix histogram issues is in camera, that's why you camera can display it. In this image I've got a model looking at an atlas face down on a carpet of leaf matter from the sequoia grove that she's in near Warburton. The image is obviously underexposed. Sam is illuminated by some small LED flood lights and a gold reflector. I was trying to hand hold so could not do a lot about the exposure without losing depth of field as my shutter speed was already down around where I'm comfortable hand holding. The only way to go further would have been to use the tripod but then Sam might move. In the end I compromise. There is an enormous amount of detail in the shadow areas as displayed in the histogram and some detail in the mid tones but there is near nothing in the highlights and whites.

To attempt to remedy the image, I dragged the histogram shadows into the mid tones and dragged the mid tones into the highlights.
This has had a brightening and positive effect on Sam herself but in the background it has made an enormous amount of noise visible that would be need to be tidied up through softening.
The lesson here - don't always work just on the histogram, I'd be better off using local adjustments to adjust Sam and the atlas only bringing them up and leaving the shadows dark. Afterall Sam is the subject not the shadows behind her.
So, as a general rule, forget the general rule and adjust in ways that suit the image and more importantly your vision of what you want the image to be.
No comments:
Post a Comment
I'll be pleased to read your constructive comments and respond